What’s New in Scoutbees – Availability Bar and Drill Down
Here at Scoutbees, we’re all about making it easier for you to ensure maximum resource availability and make conducting root cause analysis a snap.
With this in mind, we’re happy to introduce two great new features!
- Availability Bars: A simple, visual indicator that reports on the success status of your Scouts
- Drill-Down: This feature enables you to click on any graph to open up reports associated with a Scout Scout during a specific period of time.
But there’s lots more to these new features; let’s explore them together.
Availability Bars
Before we dive too deep into the Availability Bar, let’s do a quick refresher on how Scoutbees works.
Scoutbees initiates its Scouts from either Cloud or custom, on-prem locations to your selected gateway, which then attempt to open your designated published virtual workspace or application—typically Citrix Virtual Apps and Desktops or VMware Horizon. The Scout reports its findings, the times it took for each step in the connection, and also gives a reason for failure (where applicable).
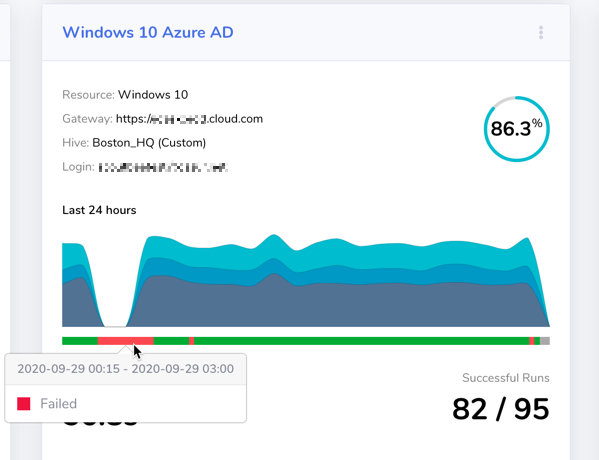
The Availability Bar works just as you might think. It’s a bar which showcases the resource’s availability. Every test conducted by our Scouts is displayed on the availability bar and their outcomes will be color-coded, as follows:
- Green: 100% available
- Yellow: Partial success (it will show the percentage during the selected time)
- Red: Failed (0% success)
So, why would you need an Availability Bar when the graph above reports on the login time? You might assume that the login times would drop to zero if a login fails. And you would be right. The issues arise from the polling interval and reporting time frame. Any spikes or dips can be averaged out depending on how you choose to report.
However, Scoutbees’ newly added Availability Bar offers an error-proof method of visualizing failed attempts without the risk of averaging out any unsuccessful logins.

You can see there is a problem; the Availability Bar confirms it. But what, exactly, is going on?
Here’s where the Drill-Down feature comes in.
Hello, Drill-Down
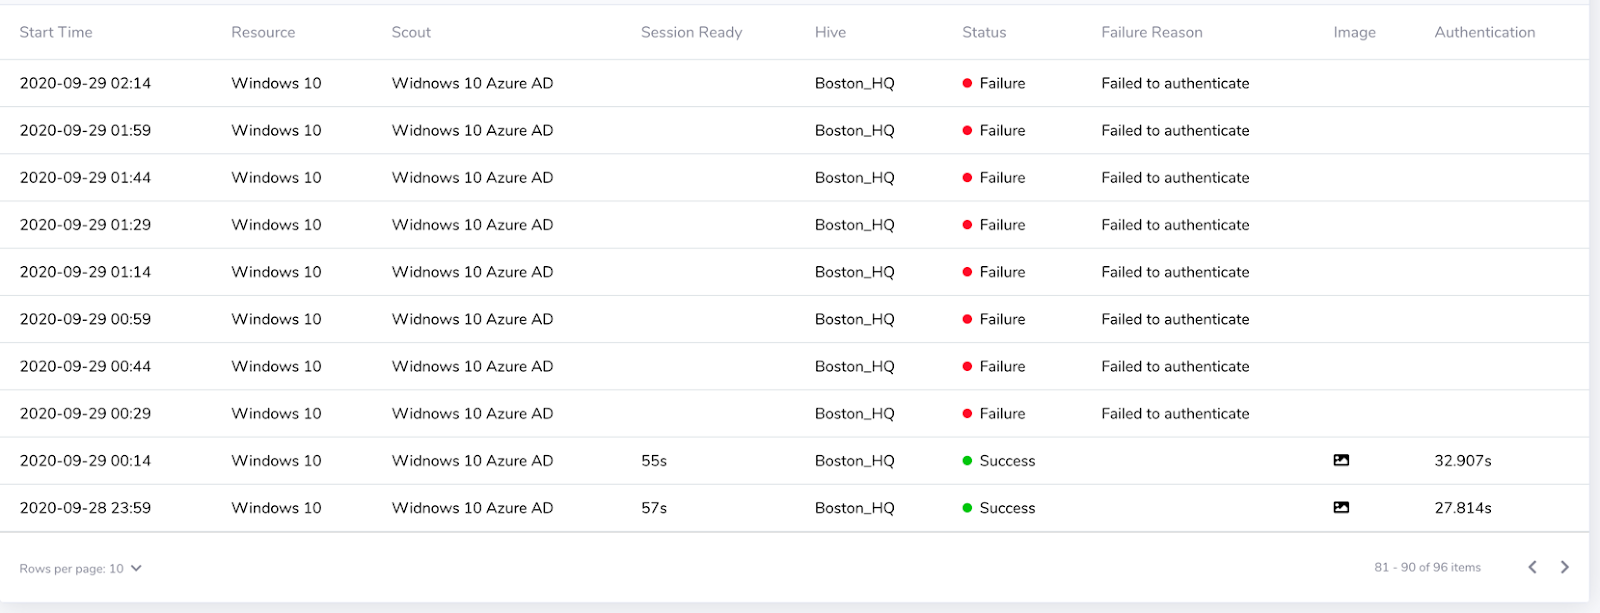
As our Scouts keep performing proactive tests on your environments and report back the availability of your services, you can retrieve full test details in just a single click with our newly implemented Drill-Down feature.
Now that your Availability Bar has confirmed there are issues, you can easily start investigating the cause of the problem. The Drill-Down feature enhances the graph and availability bar, turning it into an interactive diagnostic tool. All you need to do is use it to click on your area of interest to retrieve the relevant tests conducted. Once you’ve drilled down, you can see all the tests conducted during the period of unavailability and quickly identify the one that sticks out.
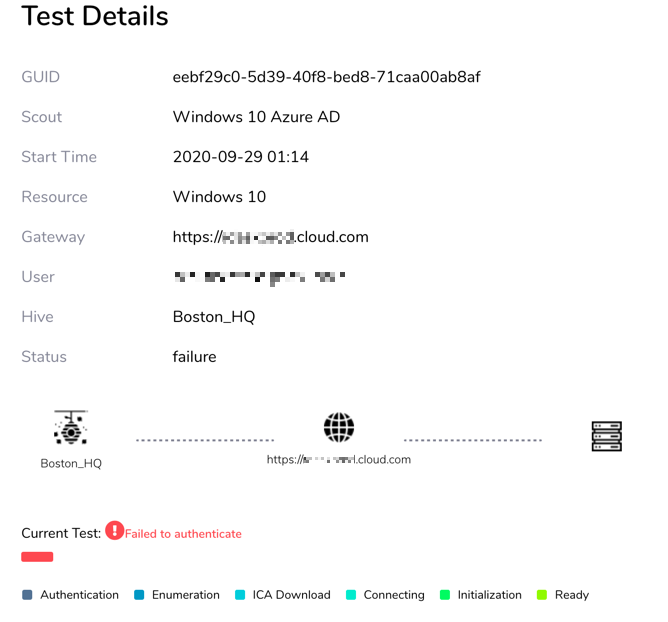
With the full test details up, you can see exactly the cause of the problem. In the instance shown, the Scout failed in the first step of the connection process, namely to authenticate to Citrix Cloud Gateway.
The Drill-Down feature also enables you to retrieve information for a specific period of time where you might see some degradation of the service (e.g. the session ready time went up). The low-level test details will show you which connection phase took the longest.
Not including the launching of the Scoutbees SaaS app, you can find out the root cause of a connection problem in as few as two clicks. Long gone are the days where you would need to squint at a graph to pinpoint the right time frame and search through logs.
More features on the way!
We’re happy to bring to you these new features to make Scoutbees an even more efficient platform. But our work here is not done; our pipeline for new features is always full.
So, make sure you stay tuned for the latest!